Create an architecture map: step by step
A guide to completing an architecture diagram for the CAF for local government.
Read a transcript of the video on how to create an architecture map (.txt, 5kb).
Use the information gathered in your architecture mapping workbook (.xlsx, 113KB) to create diagrams that accurately represent your council’s critical system architecture.
We recommend you map up to three critical systems. You might want to create a separate diagram for each system – these can be easier to produce and understand than one larger diagram.
Architecture diagrams should include all physical sites and cloud infrastructure needed for a critical system to function.
This step by step guide shows one way to create an architecture map. You can also see a worked example in the example architecture mapping workbook (.xlsx, 744KB).
1. Choose a tool to create your map
Identify a tool to produce your architecture diagrams that meets your council’s security requirements. You might already have an approved tool that you use, such as Microsoft Visio, draw.io or Lucidchart.
Make sure you choose a format that can be easily read by and shared with an independent assurer.
2. Create a new file
Create a new file and make sure you store it in a secure location.
Find out more about storing information securely.
3. Add your sites
For each architecture map of your critical system, think about the high-level infrastructure areas.
Include all physical and cloud sites that host the infrastructure and systems needed for your critical system.
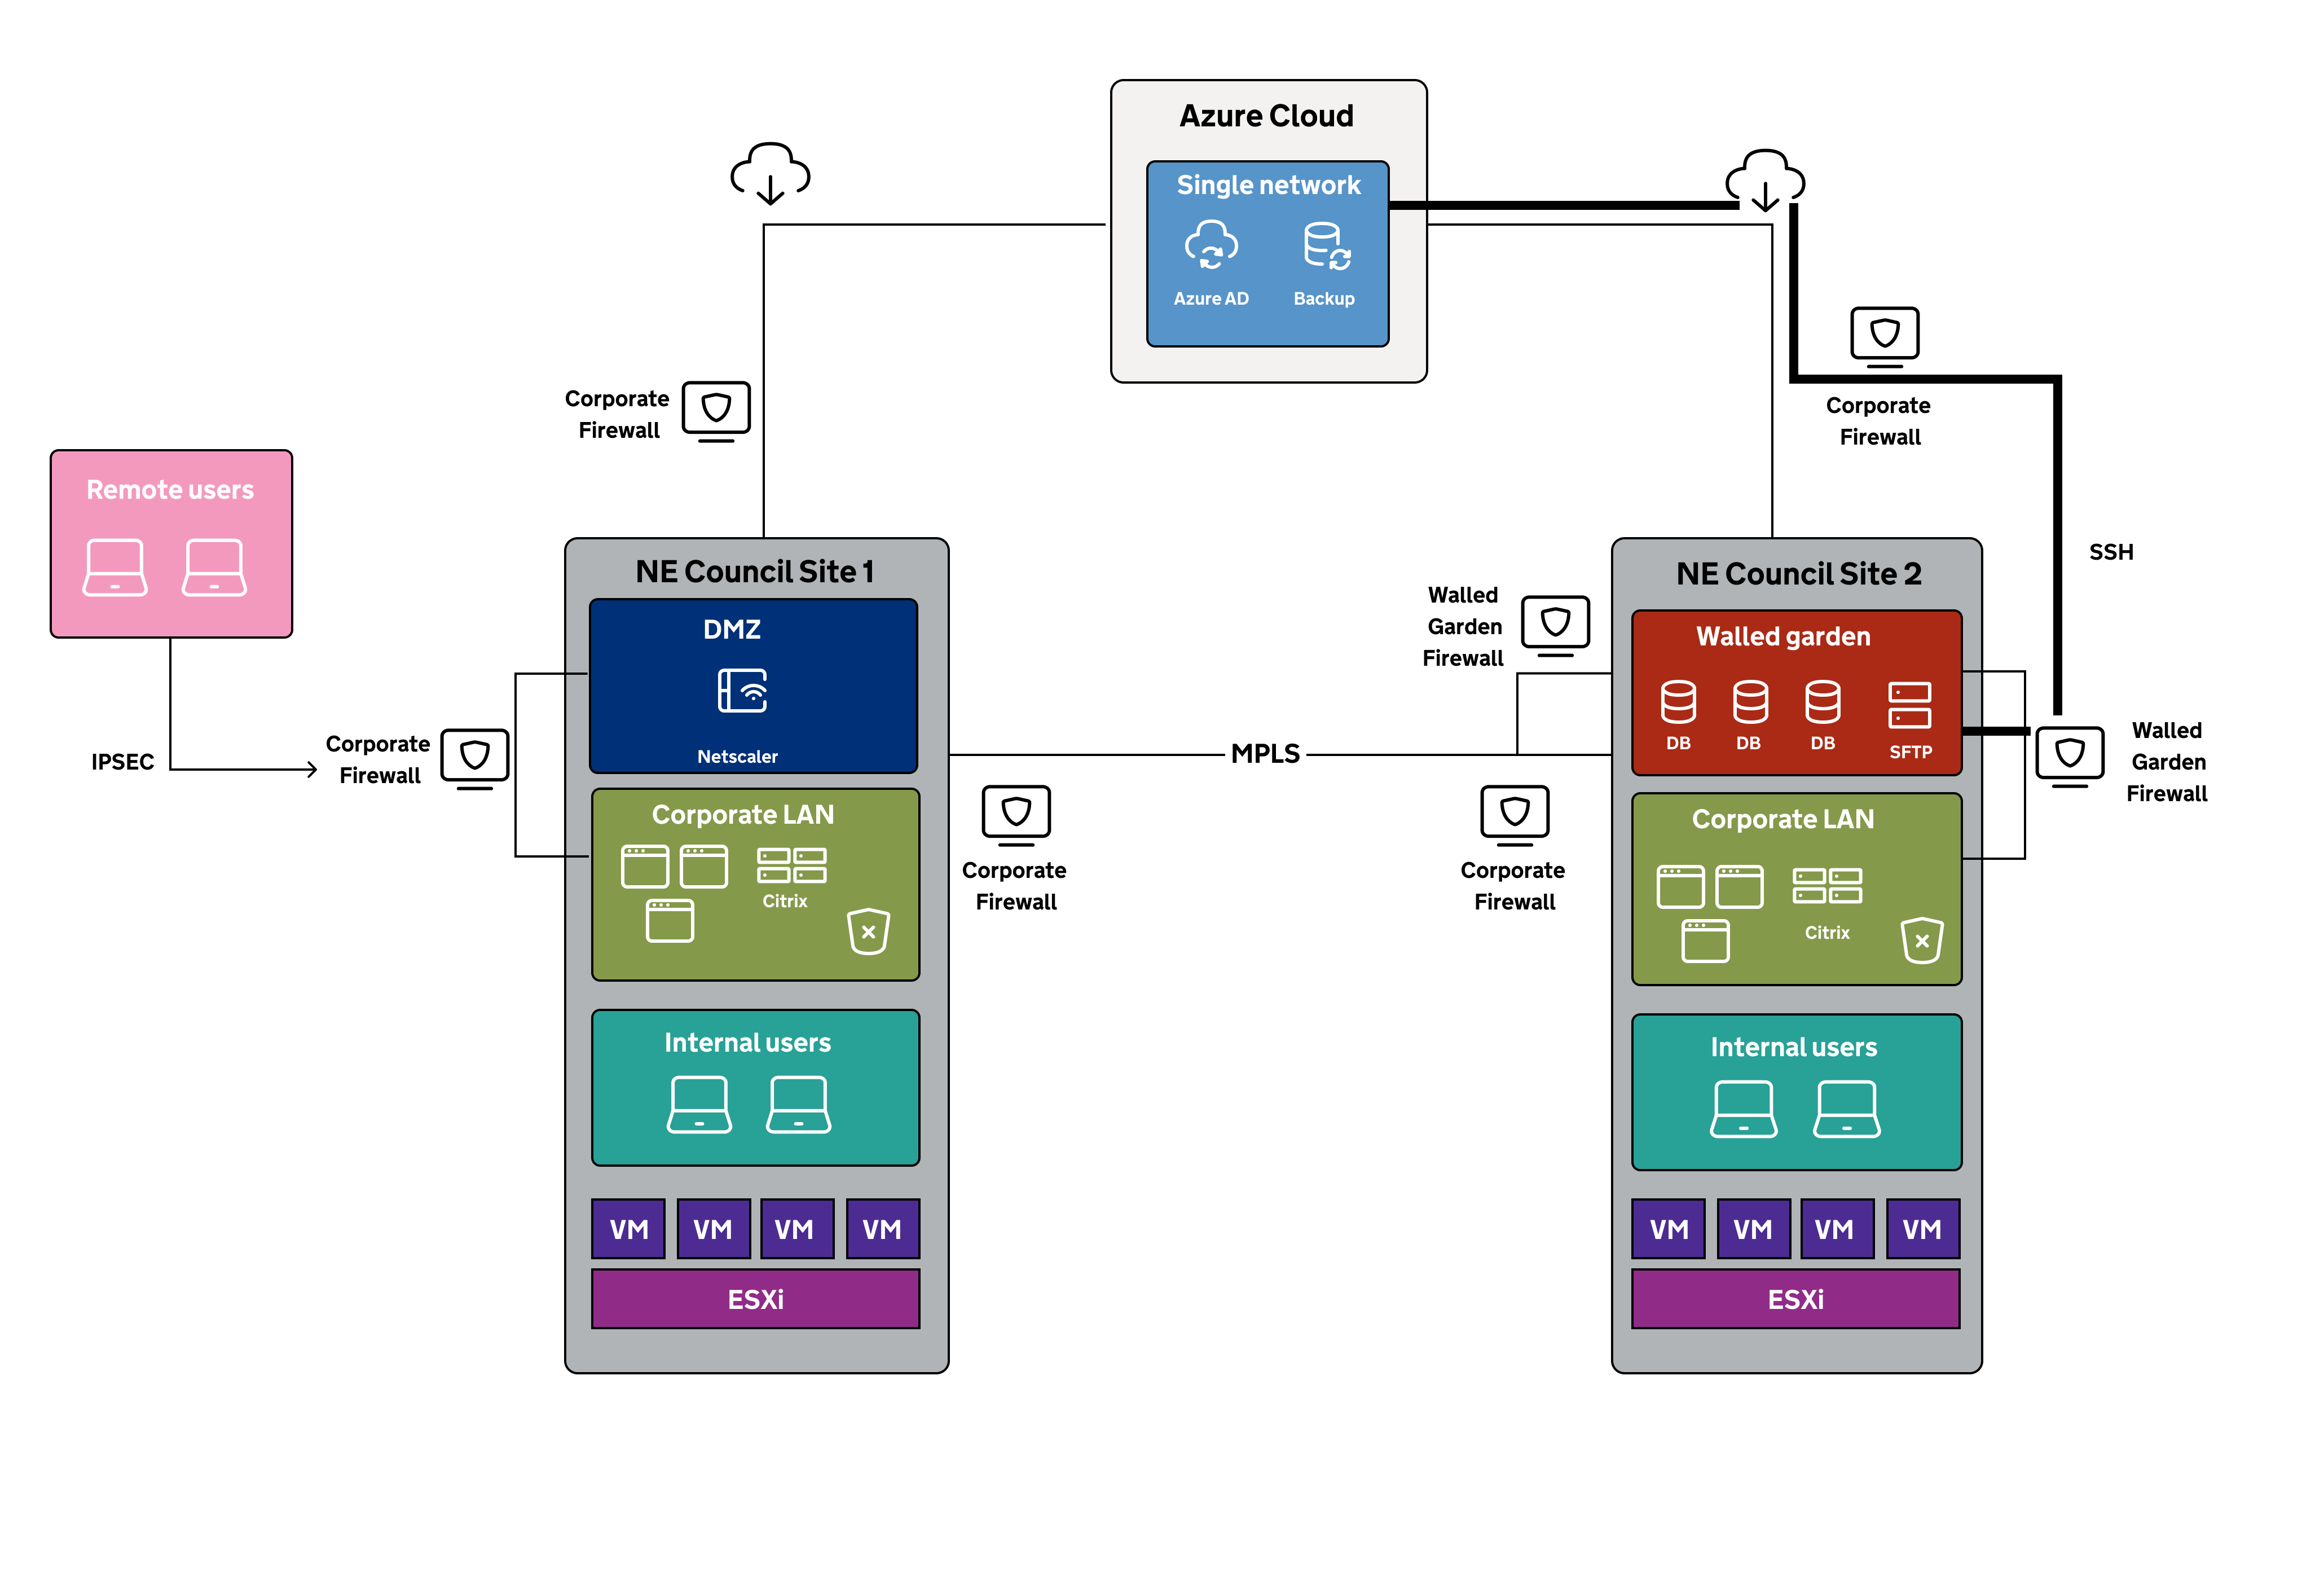
NE Council has two physical sites and an Azure Cloud environment.
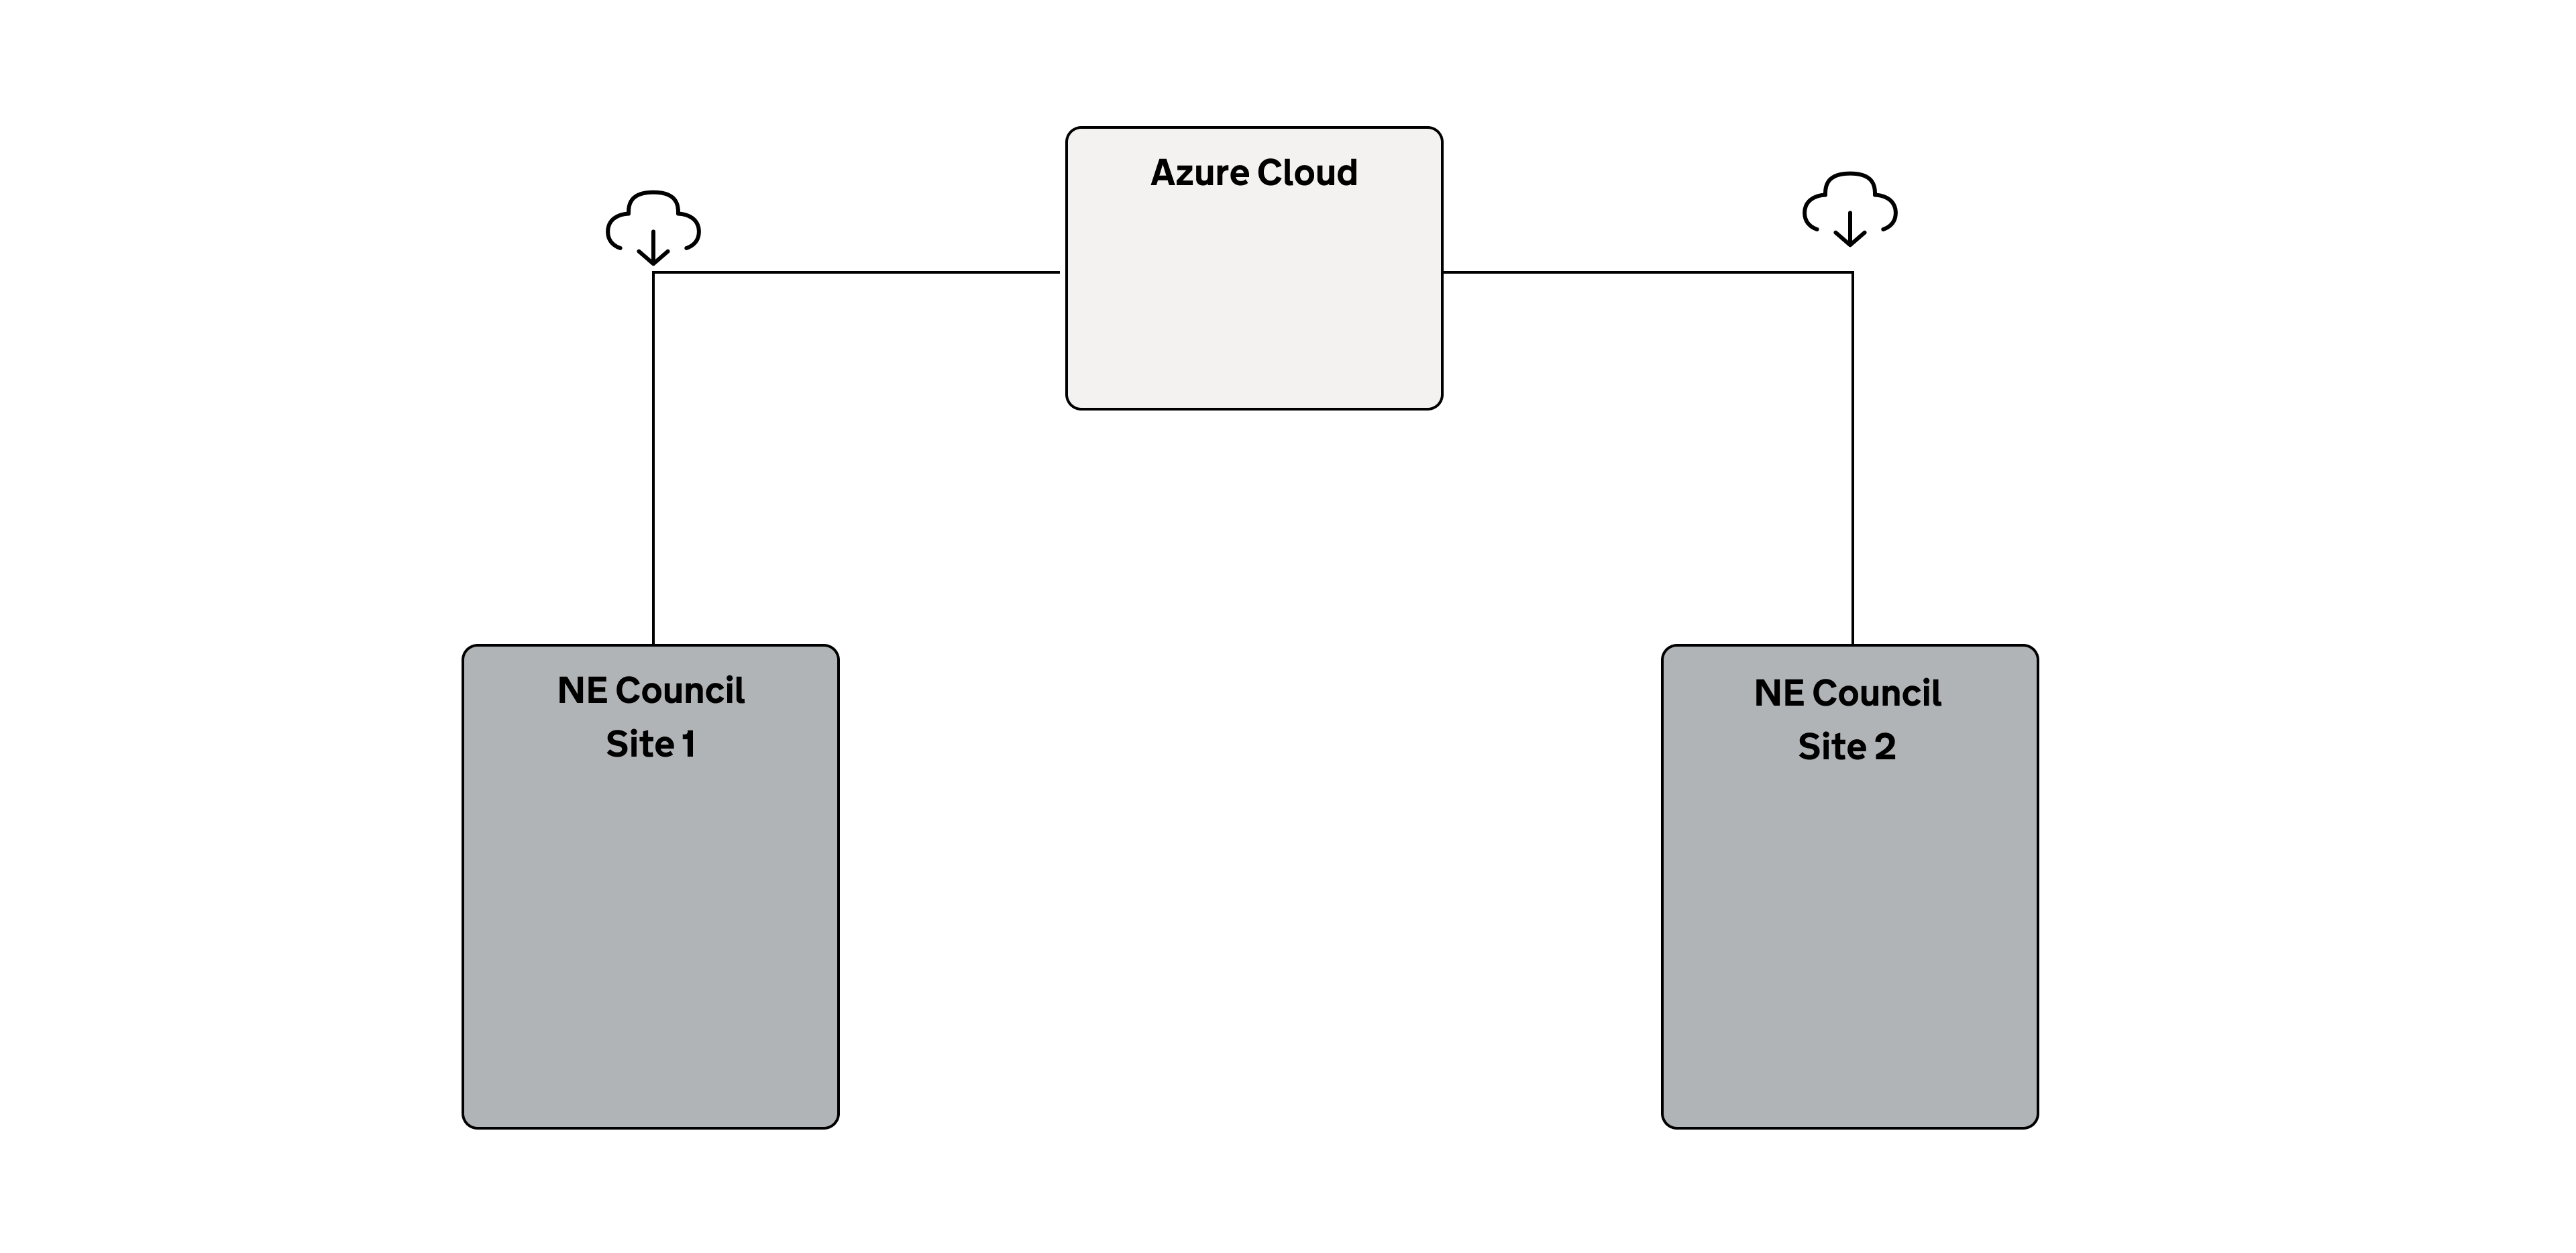
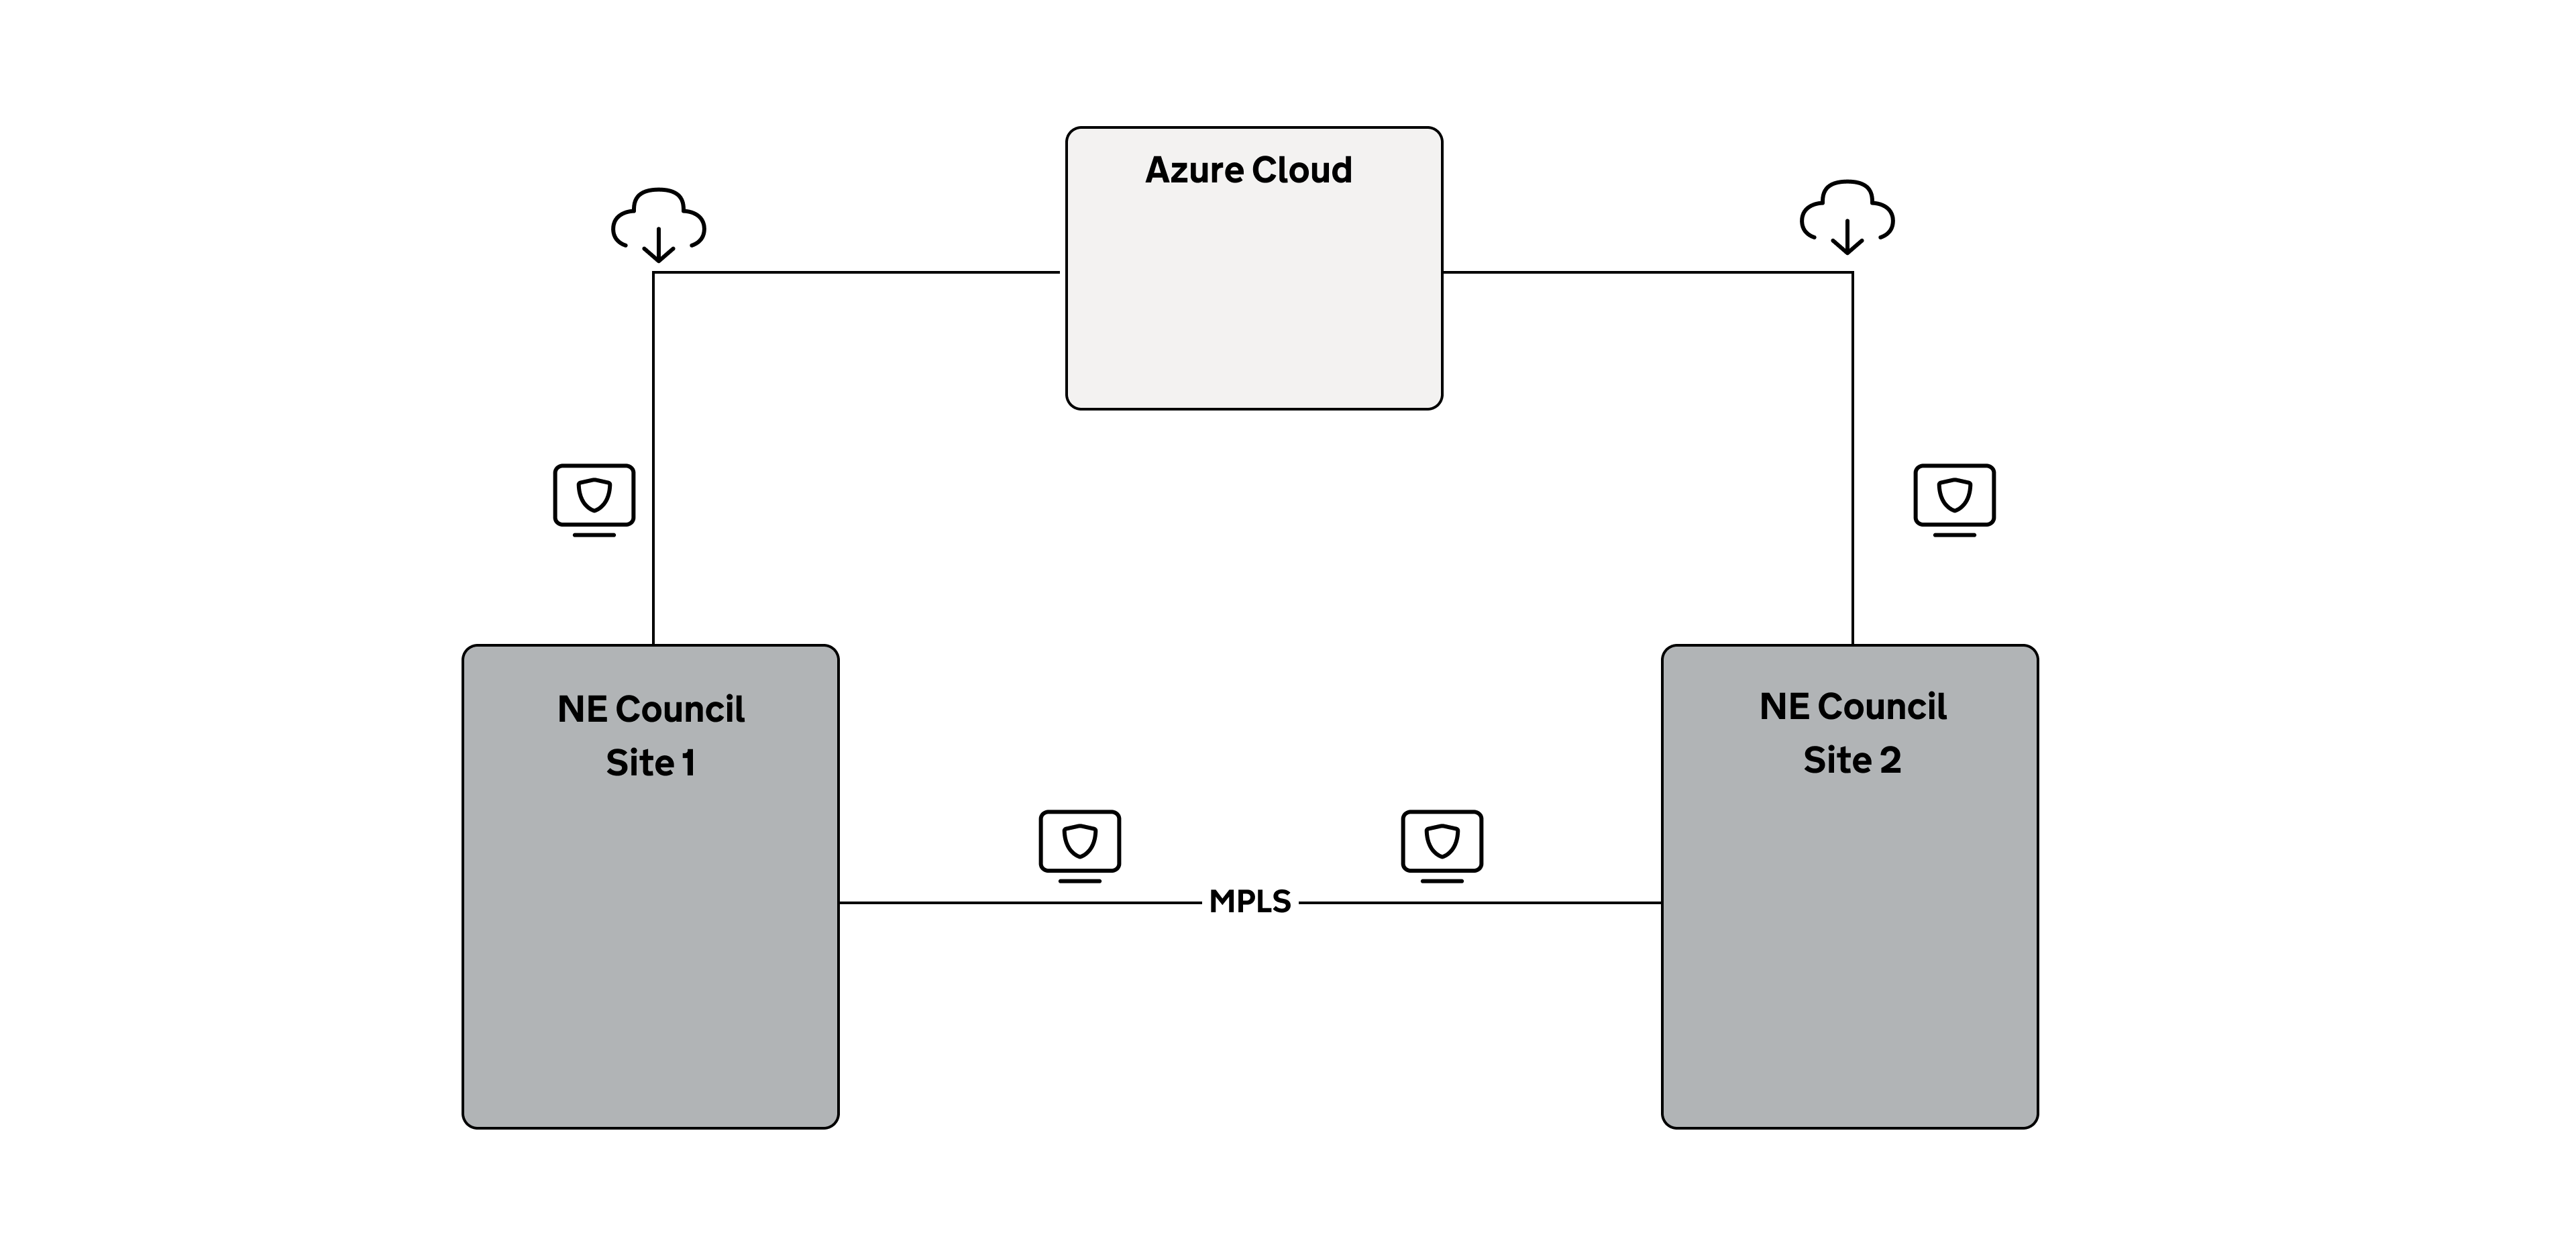
4. Add your site connections
Think about how your sites are connected. Consider any firewalls.
NE Council has an MPLS connection between the two sites, and connectivity to Azure via the internet.
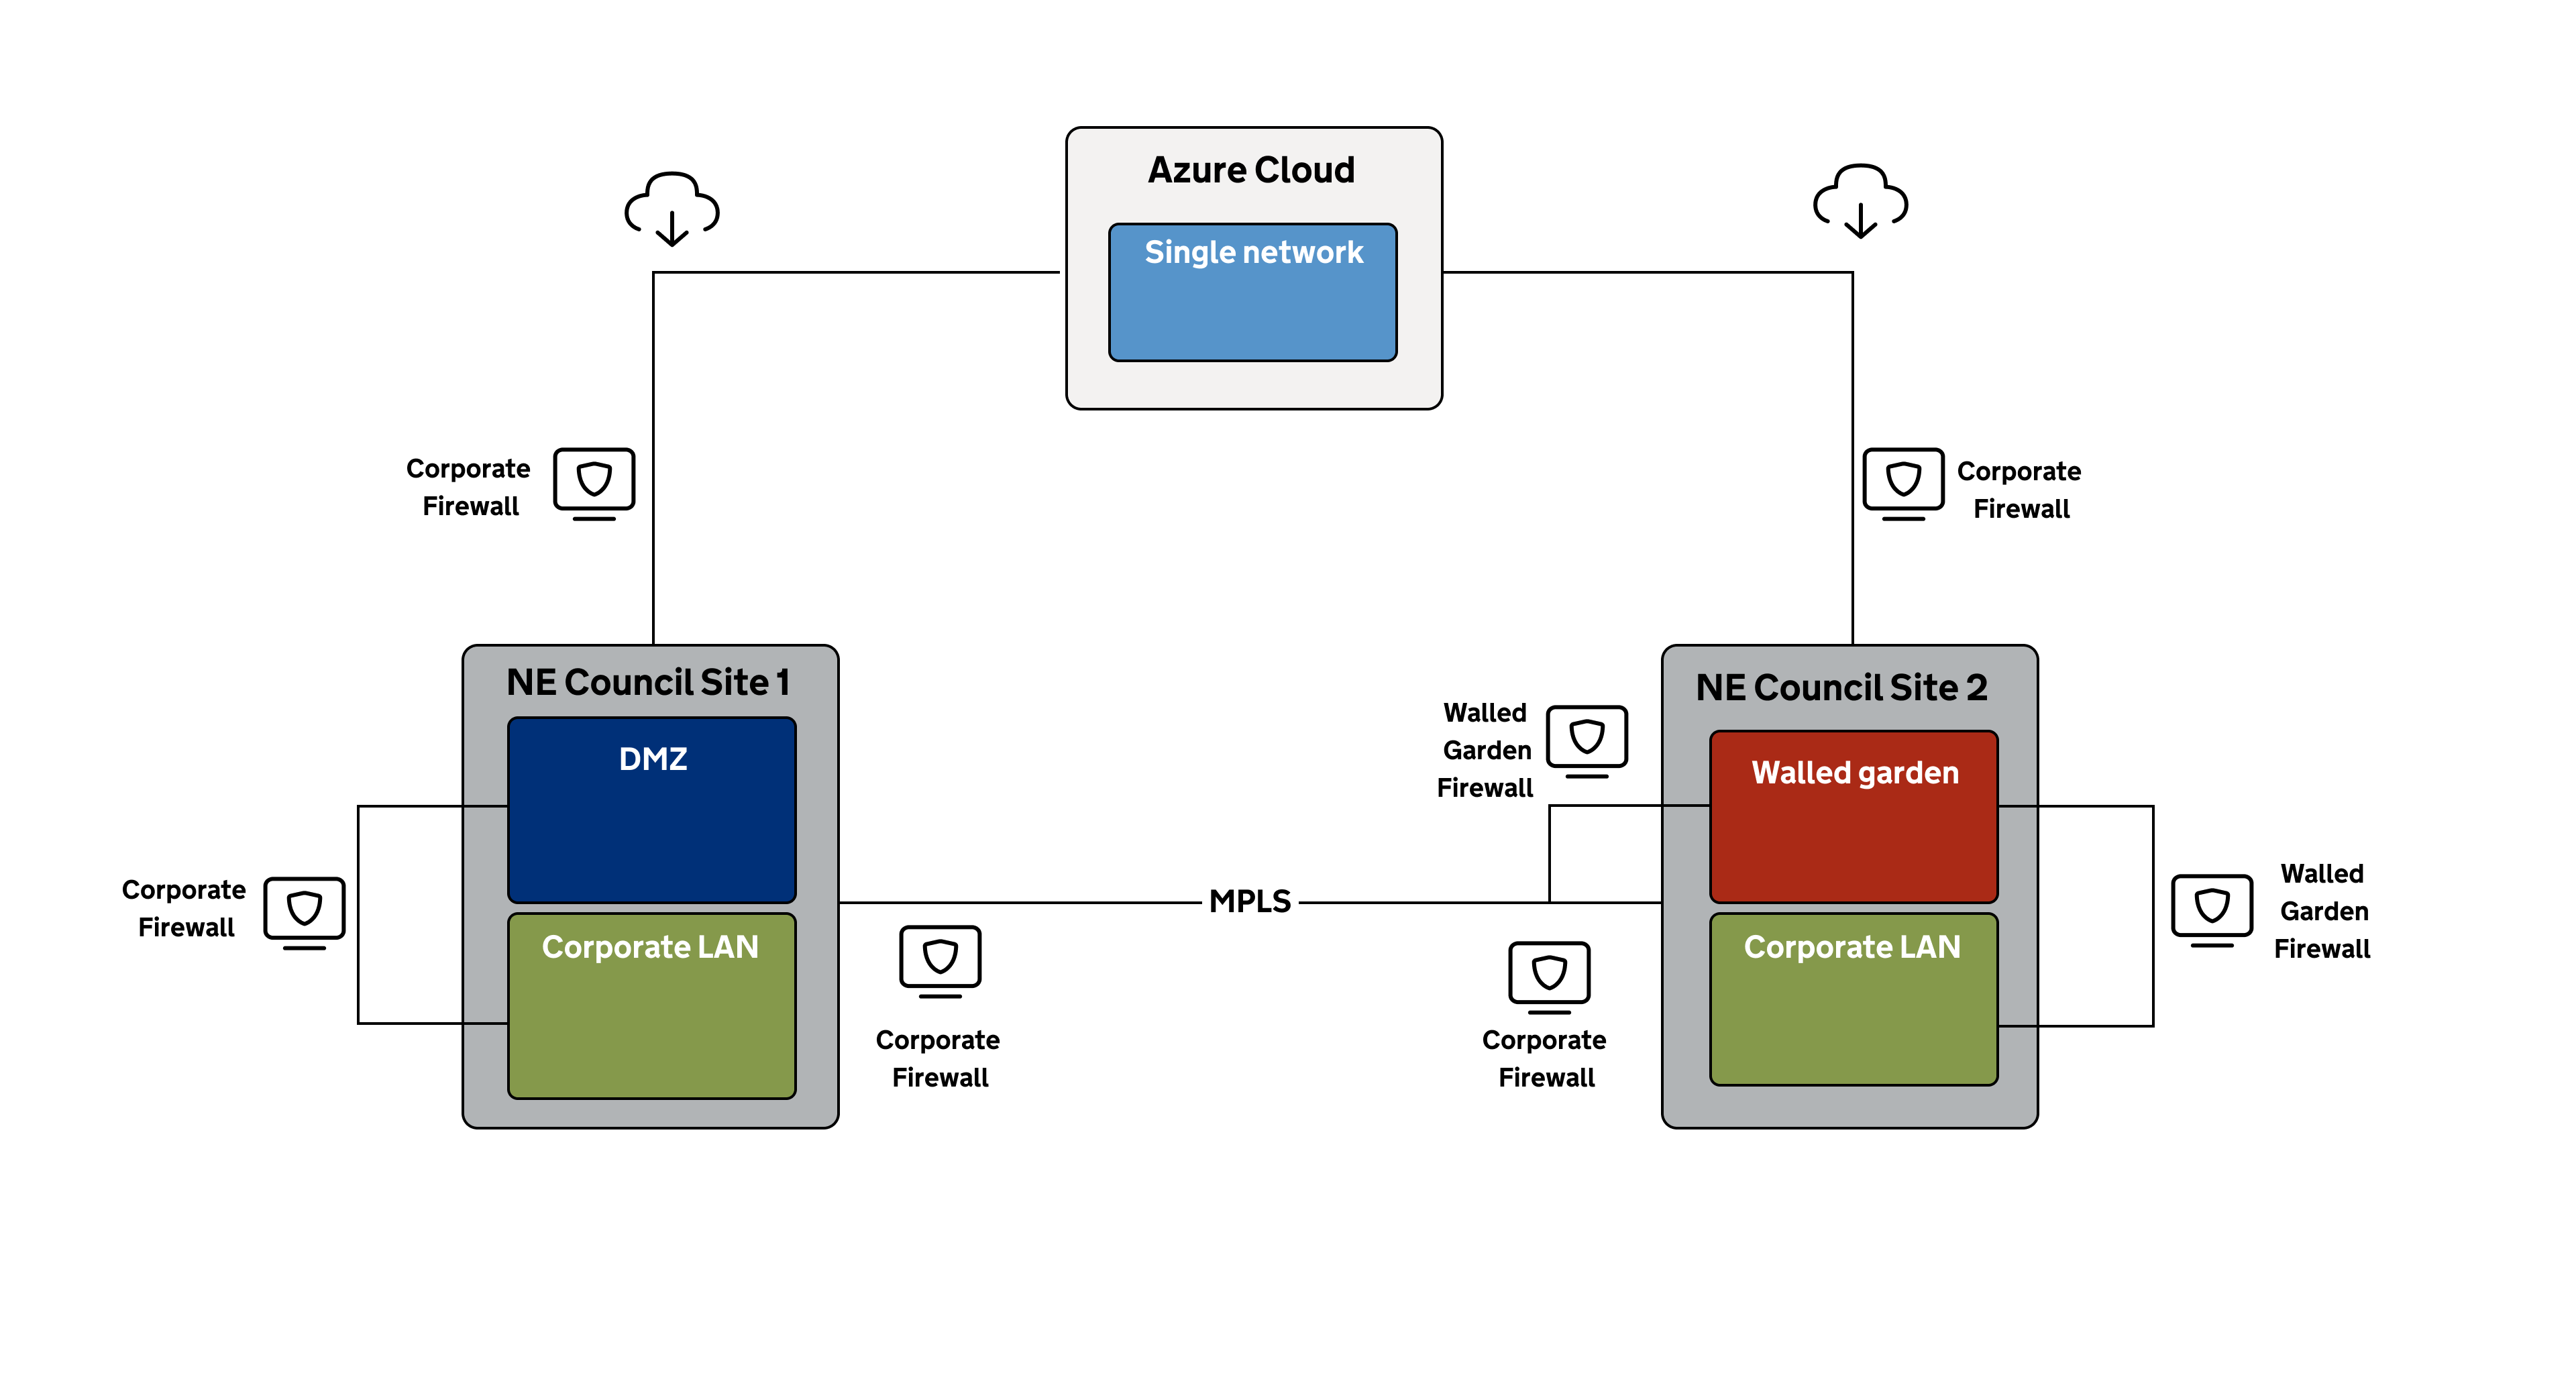
5. Add zones, networks or network segmentations
Think about the zones, VLANS, networks or network segmentations you have in place at each site.
Site 1 at NE Council has a DMZ and corporate LAN for external access, which is supported by the corporate firewall.
Site 2 has a walled garden and corporate LAN and access is controlled by a separate, dedicated firewall.
Azure has a single network.
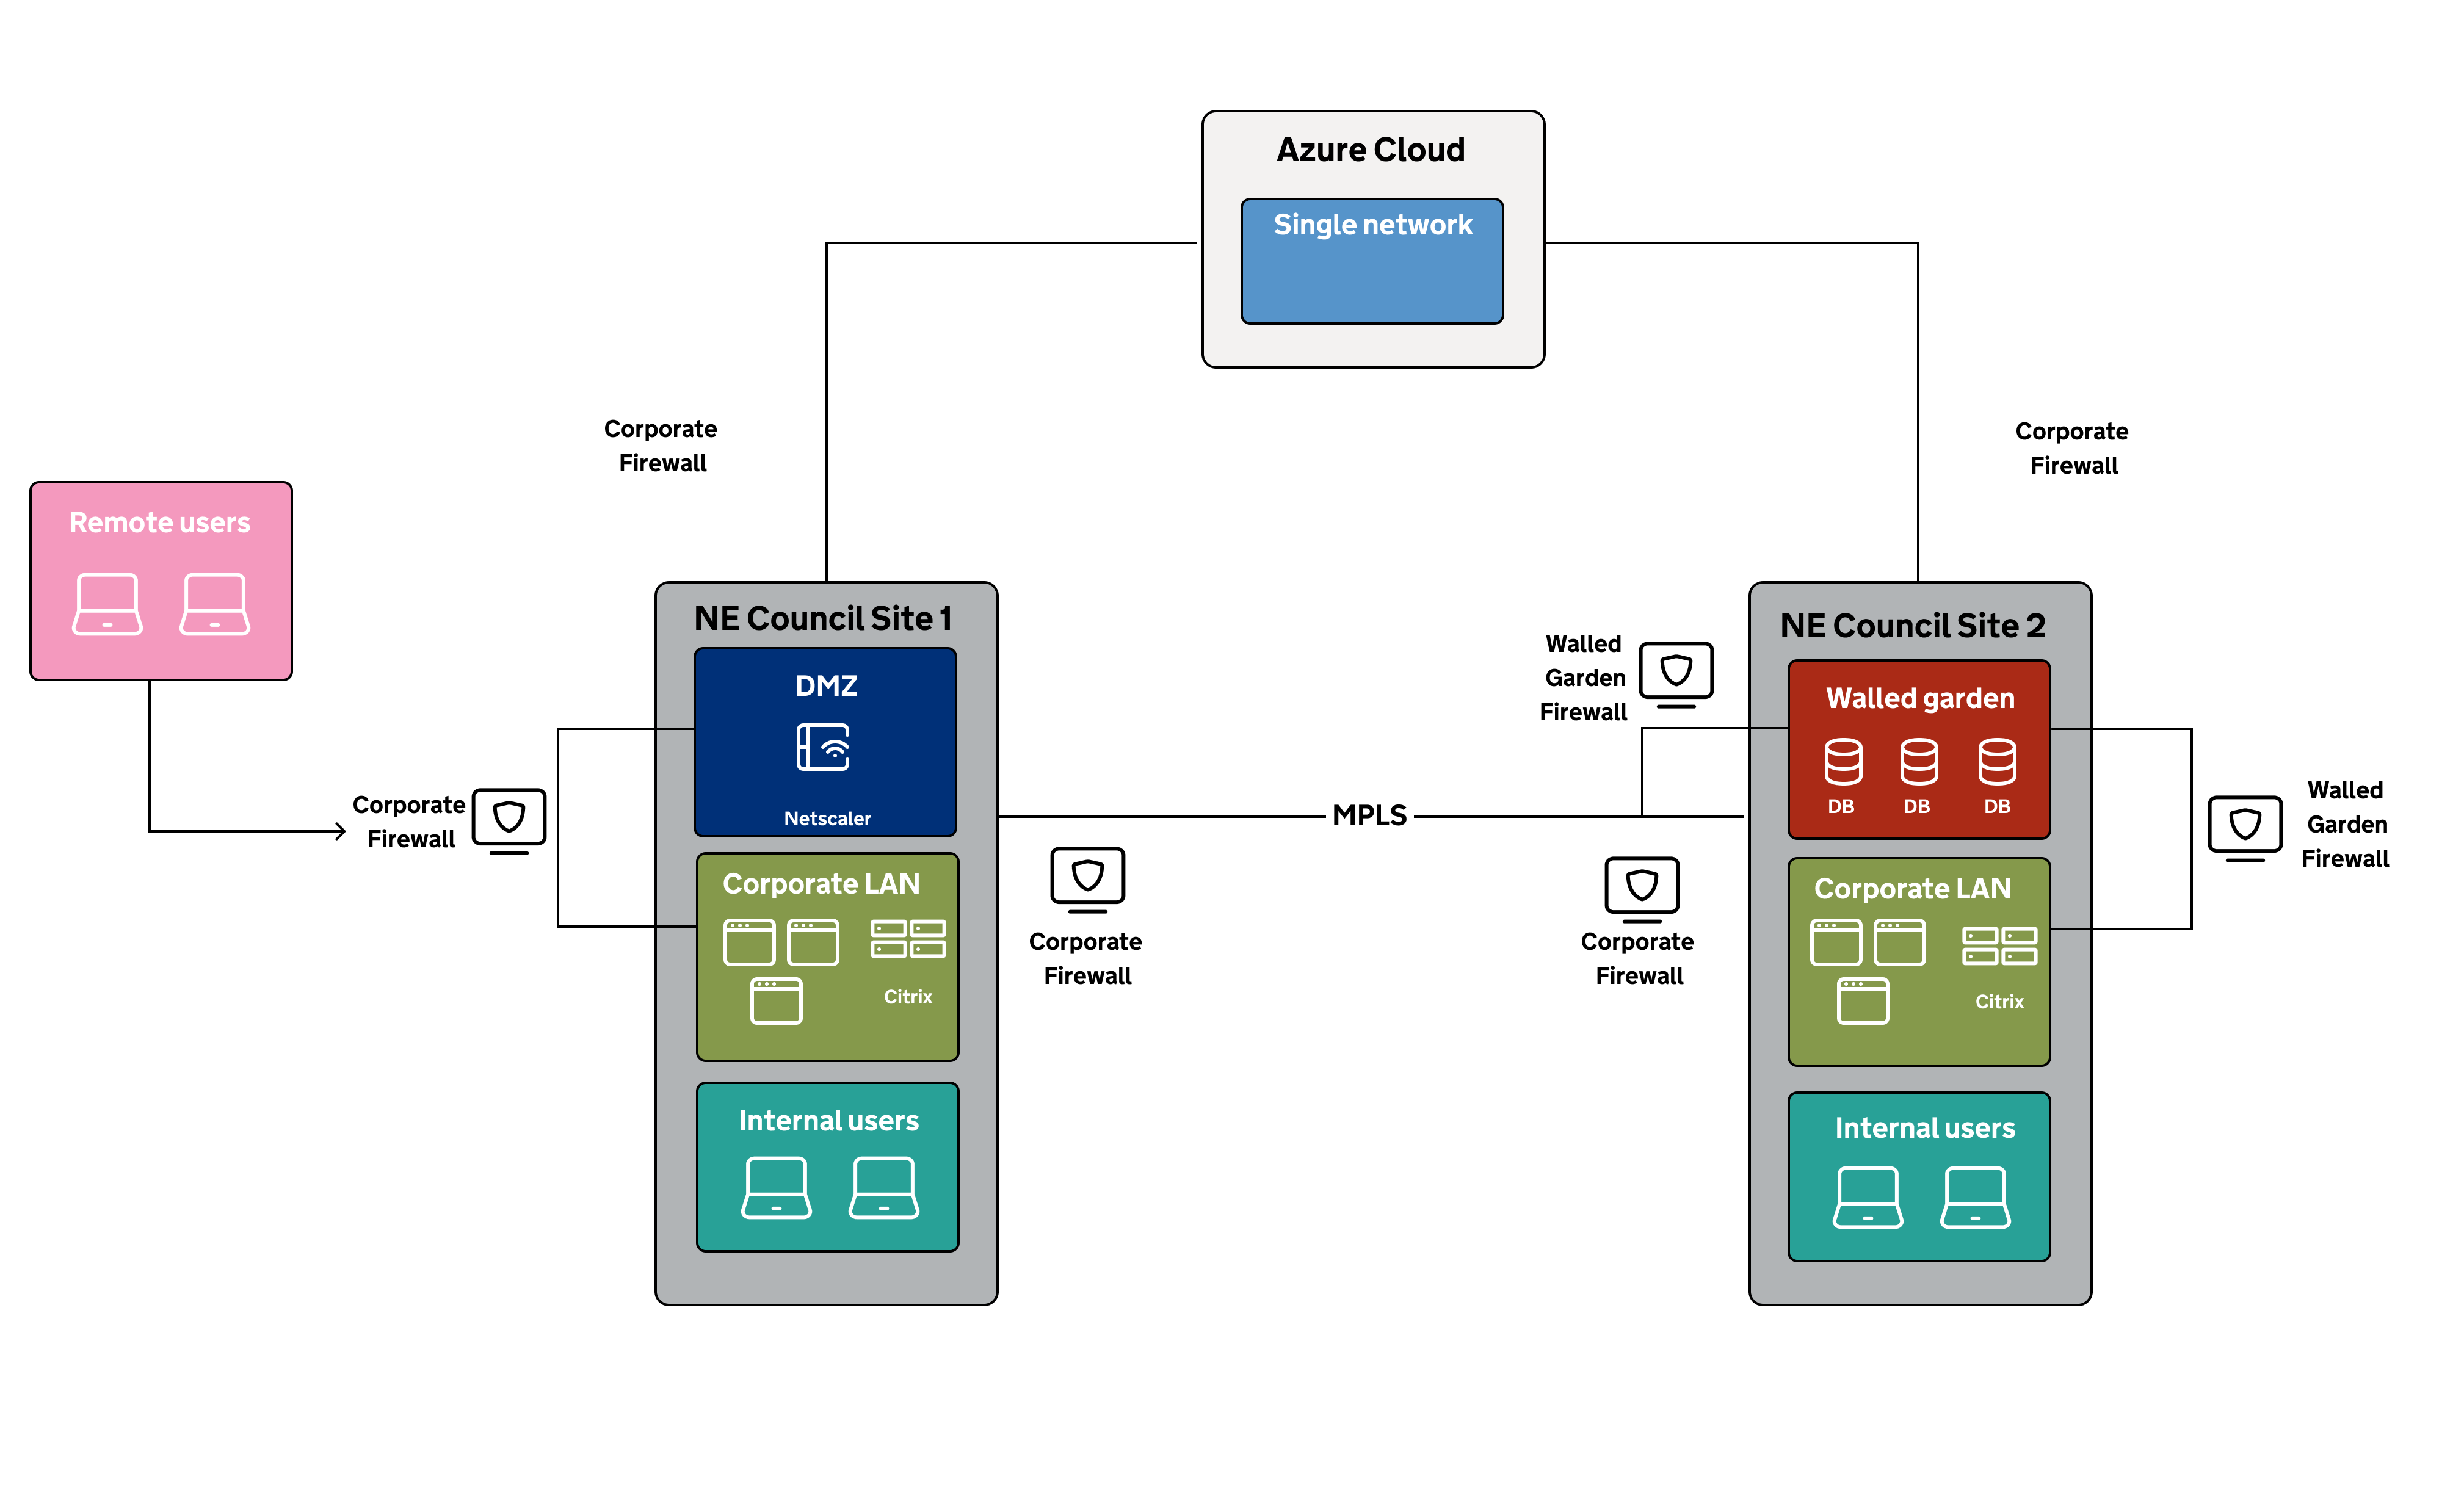
6. Add systems in place in each zone or network
Next, add any systems you have in place in each zone or network that support your critical system.
NE Council’s critical application servers are located in the corporate LAN at both sites.
Site 1 has a Netscaler in the DMZ.
Site 2 has database (DB) servers in the walled garden.
Internal users access the critical systems directly. External users access the systems via the Netscaler and Citrix.
7. Add dependencies and infrastructure
Review where dependencies and infrastructure are located and add them to your diagram.
NE Council has on-premise active directory (AD) servers with Azure AD in the cloud. SFTP servers in the walled garden transfer files for backup to Azure. All servers are virtualised on VMware ESX at both sites. External users connect via VPN using the IPSEC protocol.
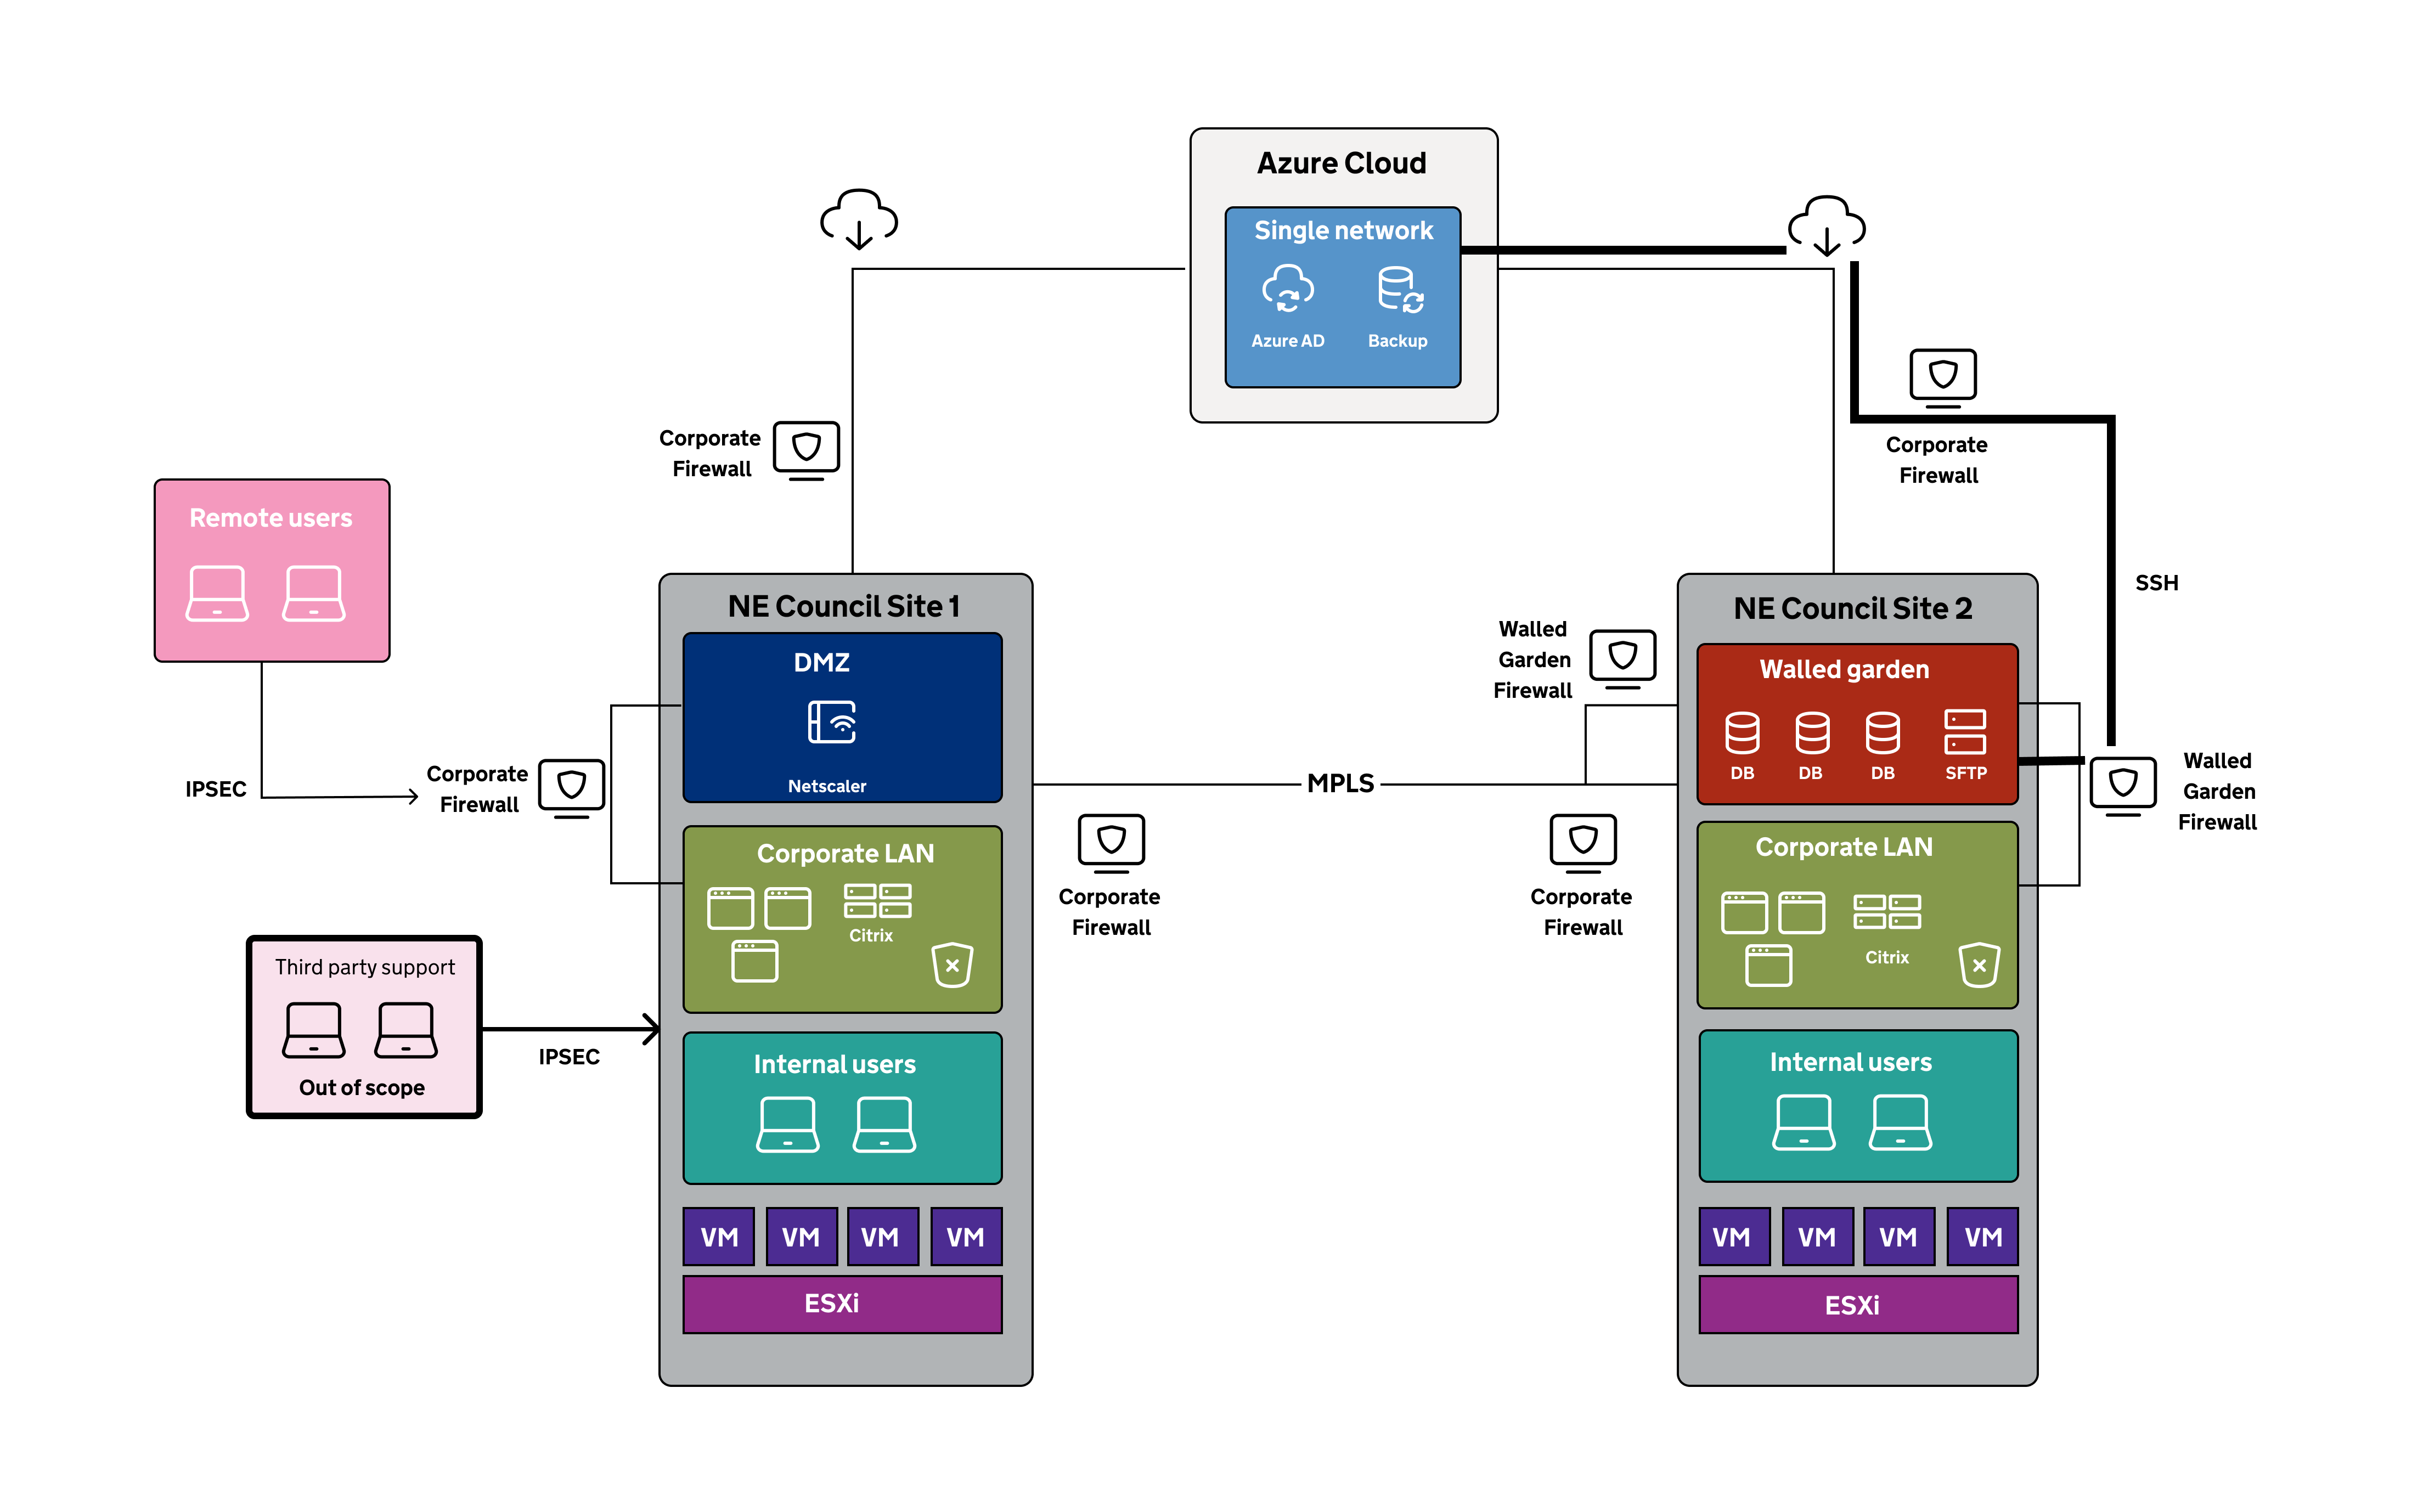
8. Indicate systems your council has excluded
Clearly indicate on the map anything your council has excluded from your scope. Choose something that is easy for your independent assurer to understand. You could:
- mark a boundary around the system
- colour code your systems
- grey out the areas that are out of scope
Annotate your map with any security implications of the cloud or commercial (third-party) systems that you plan to exclude.
In your workbook, explain why you have excluded a system.
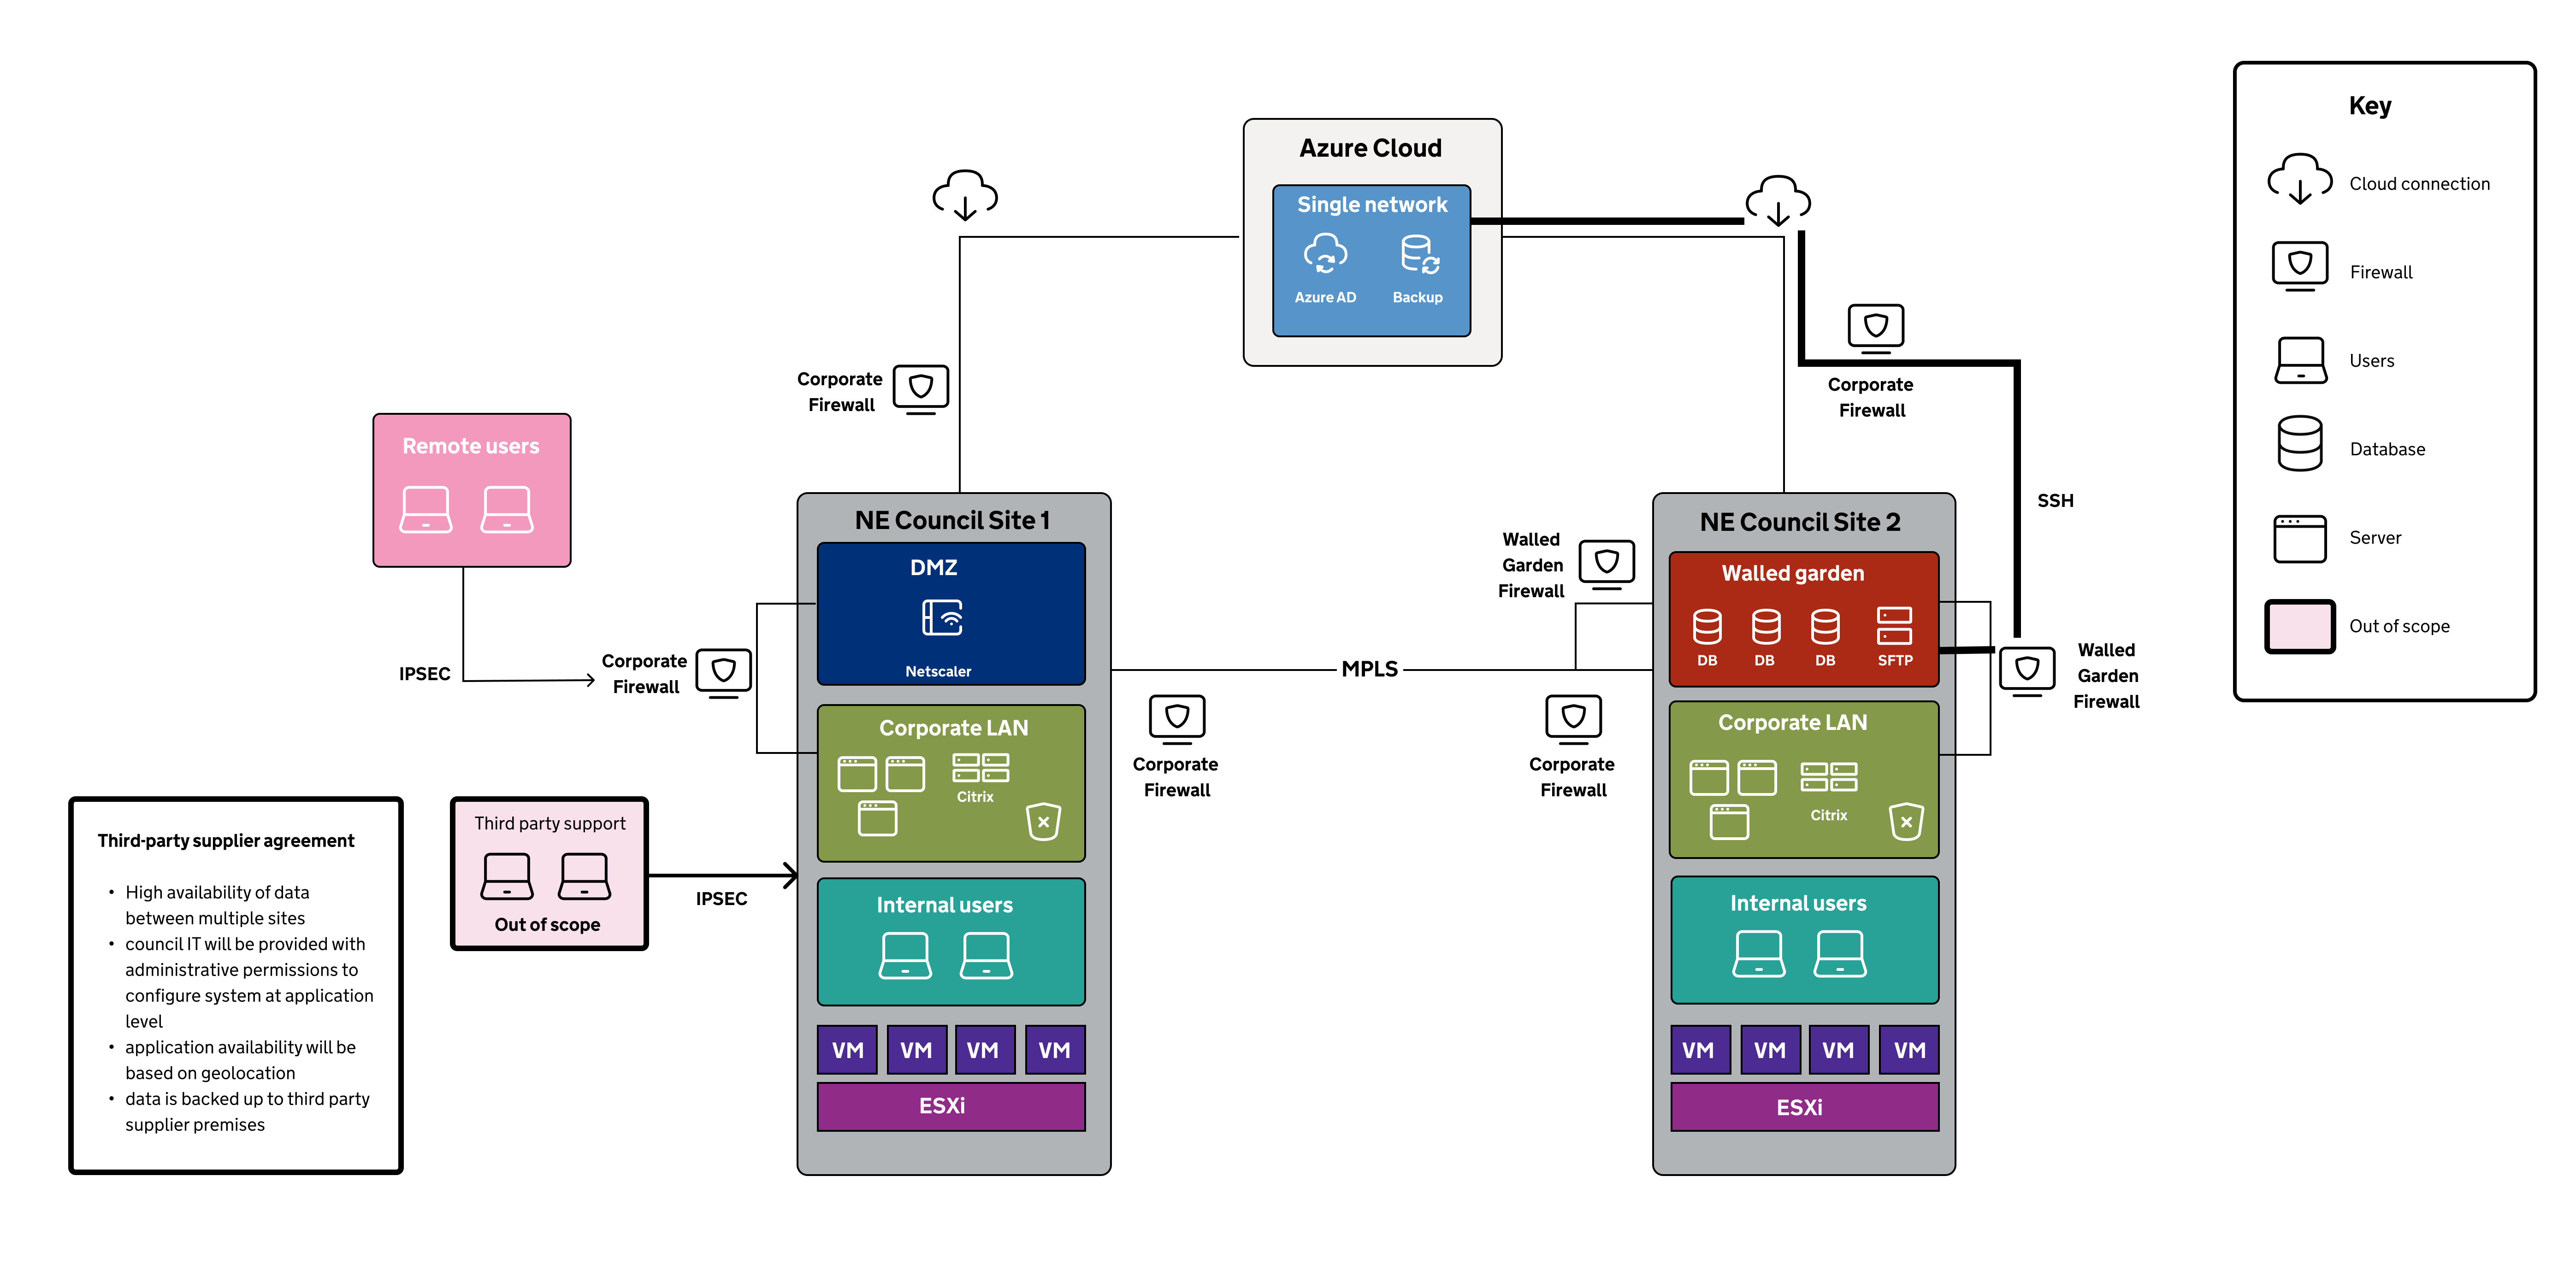
9. Annotate your diagram
Include a commentary to help your independent assurer to understand your architecture. This might include:
- a description of the sites
- number of users
- important information about commercial (third-party) service providers
- description of components – for example, active directory, data stores
Include a key or legend to explain how you have indicated important components and characteristics. For example, you might use different colours to highlight:
- legacy systems
- security information and event management (SIEM)
- end user devices
- data stores
- network segmentation
- parts of the architecture that are in scope or out scope of the CAF
10. Anonymise your architecture map
These should be high level designs. Before you share these with an assurer, remove or anonymise sensitive information. This includes:
- IP addresses and subnets
- host names and FQDNs
- credentials
- port numbers
- detailed configuration
- virtual LAN IDs
11. Save your diagram in a shareable format
Save your diagram as a PDF, PNG or format that will be legible to your independent assurer.
Embed the diagram in your architecture mapping workbook, or upload the file to the same secure folder as your workbook ready to share with your assurer.
Repeat these steps for each critical system your council has decided is in scope.
Downloads
Download a worked example of an architecture map (.xlsx, 744KB)